DAMAST: Investigation of Jvari-Lake Sediments
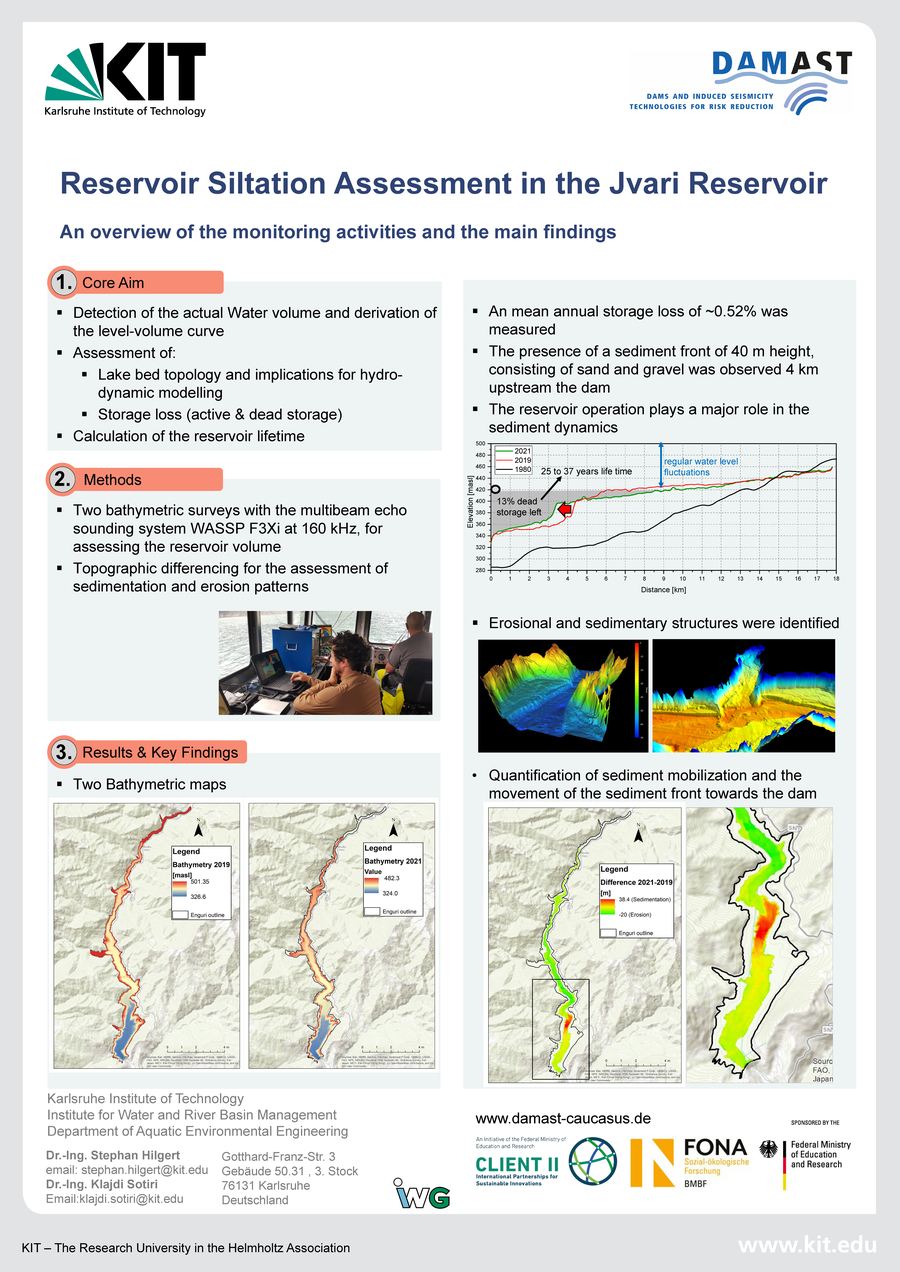
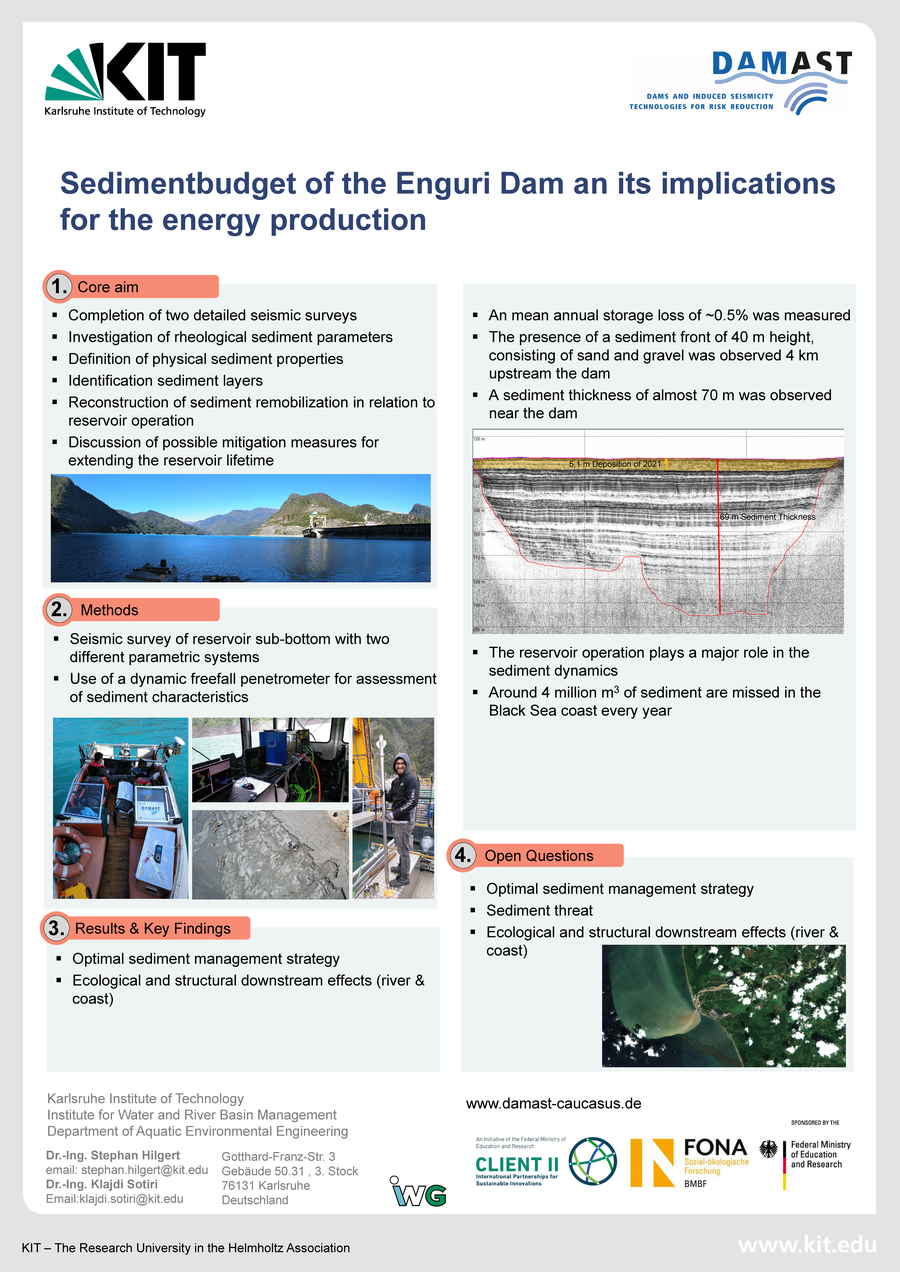
One goal of the DAMAST project is to investigate the sediments in the Jvari Reservoir. Before the dam construction the Enguri river had the characteristics of a mountain river. Due to the dam construction the Jvari reservoir developed and with time big and small pieces of rock gravel and sediments fill the reservoir. If this material is mobilized by earthquakes or landslides it could endanger the dam construction. Thus the goal is not only to investigate the bathymetry but also the sediment layers and the composition of the sediments.
Methodology
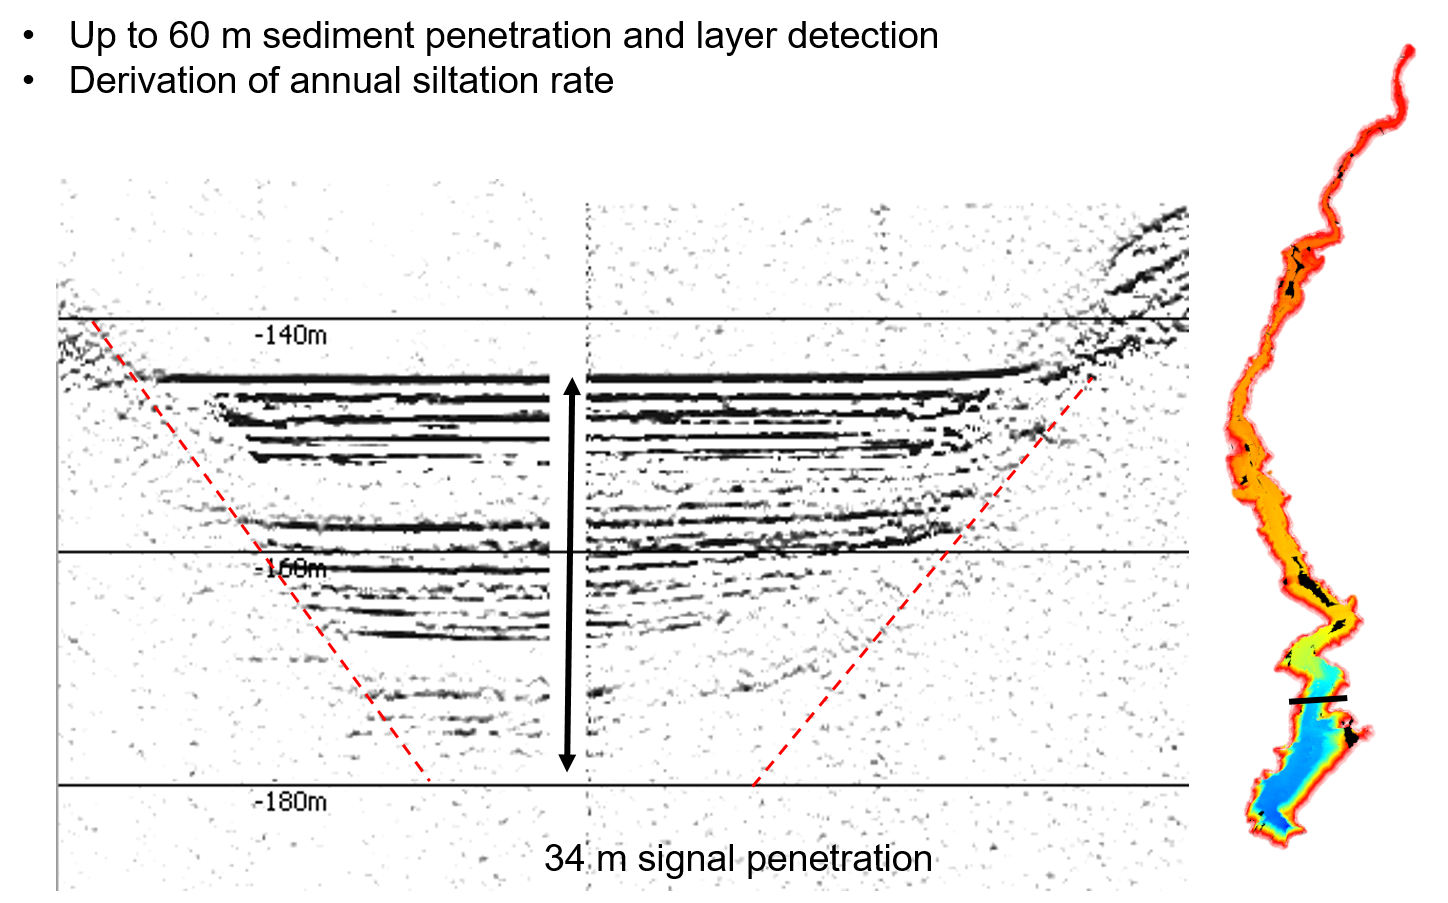
The approach of the IWG-SWW team is the combination of a multibeam echo sounder and a sub-bottom profiler with additional sediment sampling for ground truthing. We aim for the high-resolution detection of the actual bathymetry and the detailed investigation of the sediment thickness and layers. The data is used to generate storage capacity curves (also called capacity tables) at varying reservoir elevations. We also produce information about the amount of sediment stored within the reservoir and estimate the remaining life time.
Equipment
The SES 2000 Compact is an echo sounder, which can cover a water depth range from 0.5-400 m. Depending on the sediment type and noise, it penetrates the sediment by up to 40 m. Its layer resolution varies from 1-5 cm. It has a primary frequency band of 85-115 kHz for the acquisition of the bottom track and a secondary low frequency band of 2-22 kHz for the sub-bottom data. The echo sounder can emit up to 40 pings/s. The system runs on 100–240 V AC 50- 60 Hz and its power consumption is less than 200 W according to the manufacturer (SES-2000 compact - Innomar: sub-bottom profiler). In order to cover a wide range of frequencies, soundwaves of 6, 10, 12, and 15 kHz frequency were used for this campaign. This wide range of frequencies was needed to investigate, which of the frequencies yields the best sediment penetration and resolution.
First results
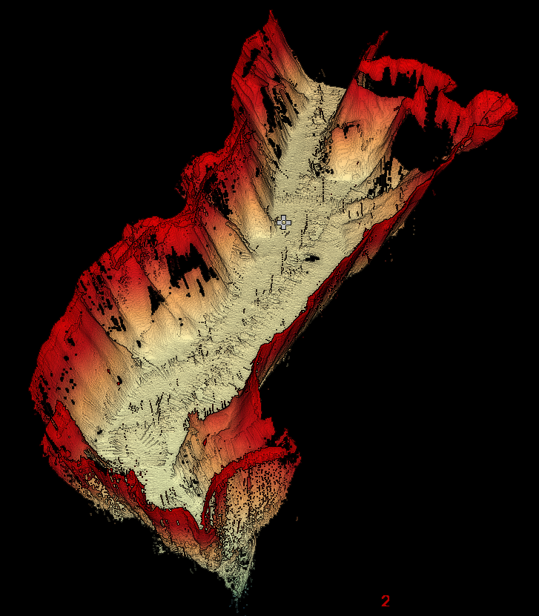
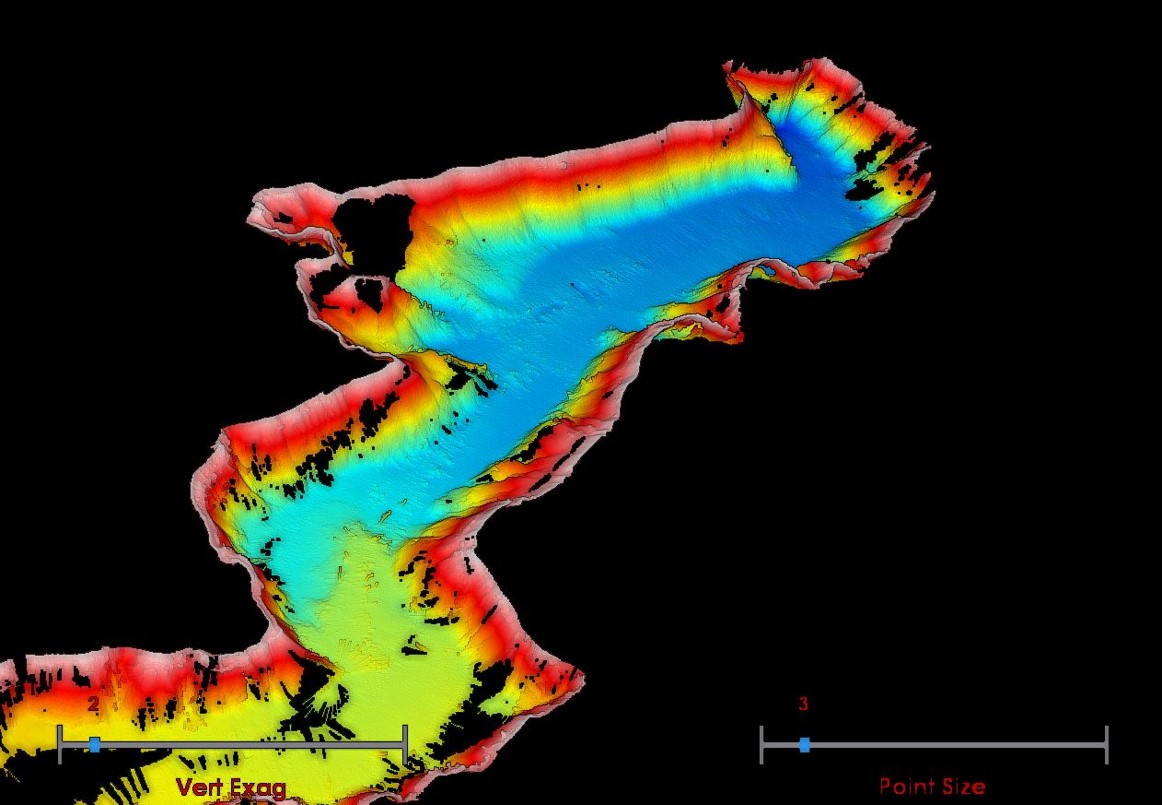
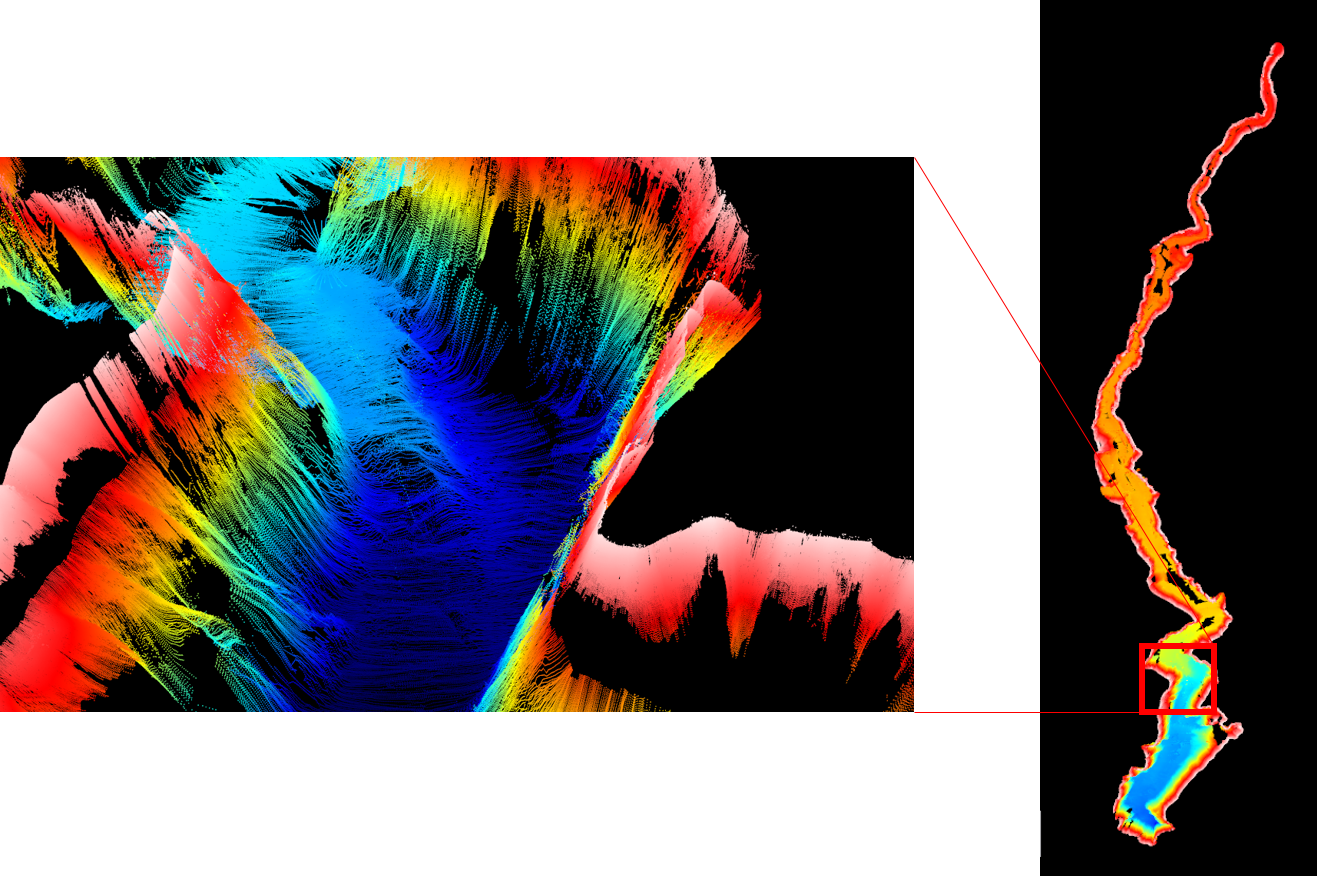
The bathymetric study was conducted successfully. In parallel, we performed the sub-bottom profiling campaign in 2019. The following images show impressions from the field and first results.