Geomechanics & Geology
Stress and Pore Pressure Monitoring
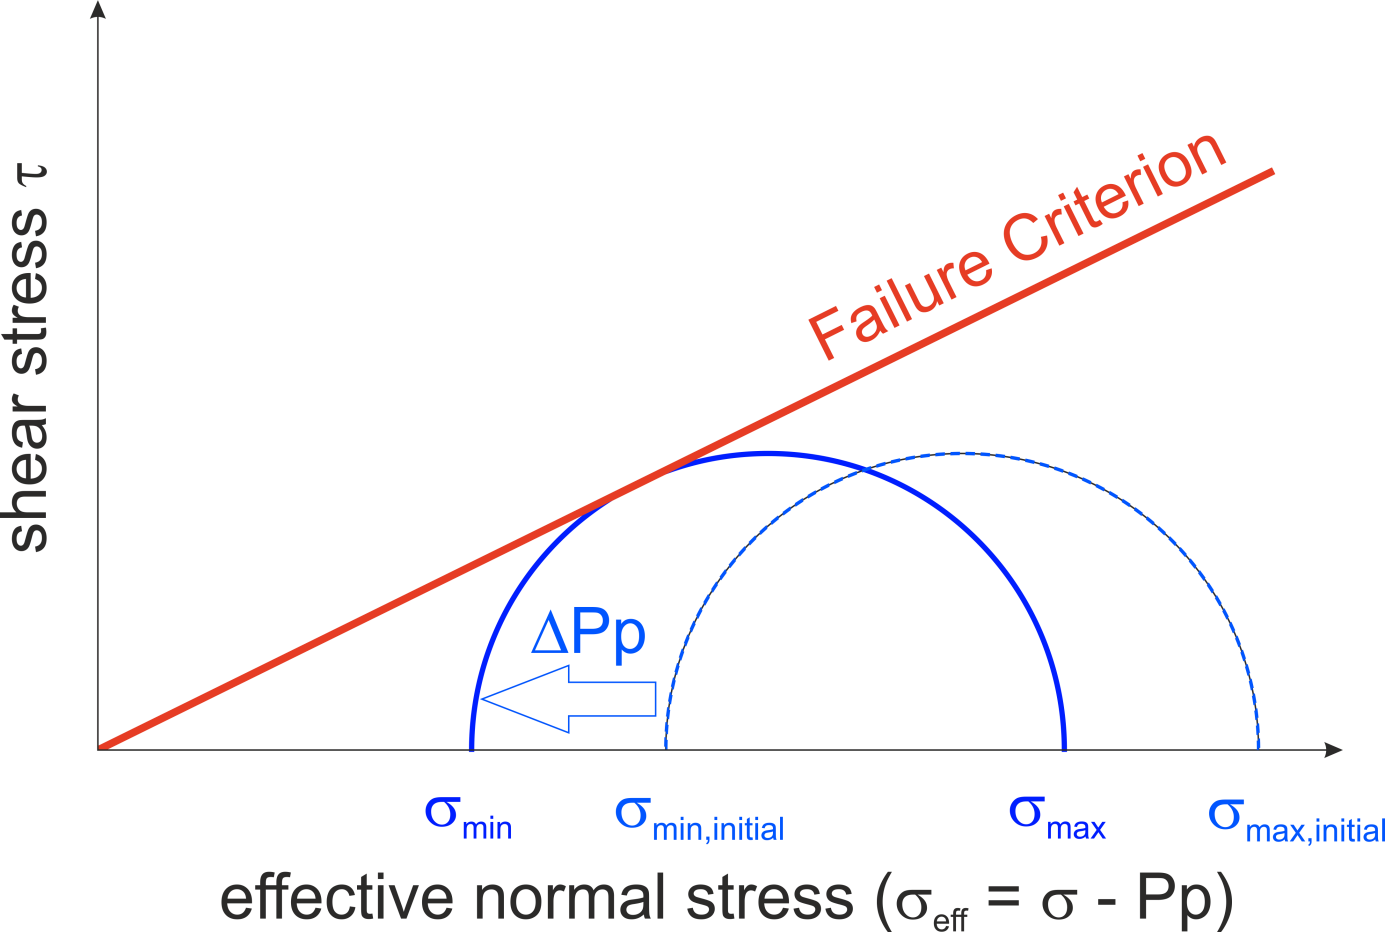
Figure 1: If the effective stresses are reduced by an increase
in pore pressure (ΔPp ) the Mohr Circle can reach the
failure envelope and faults can be reactivated. Here a 2D
display of stresses is used.
To identify the dominant processes of induced seismicity around high dams, we use a simple mechanical model based on a Mohr-Coulomb approach, which combines the failure theory of Coulomb with Mohr´s hypothesis and Mohr´s description of the state of stress using the so-called Mohr circles.
Activities & Preliminary Results:
- Referencing of map information (different geodetic datum) to enable merging of information
- Identification of Fault structures from geological maps and in the field (May 2019, October 2019)
- Based on the Map studies and results from the field trip the drilling locations for the 2 deep wells have been identified
- Stress field investigations: To understand the modifications of the stress field due to the building and operation of the Enguri Dam and the Jvari reservoir, we compiled information about the stress field of the region before the impoundment of the reservoir.
Figure 2: Stress profile at the Khudoni dam
area including data from Rummel & Baumgärtner
1985 for DFG Project RU225-4 and assumptions
for the vertical stress gradient and the pore
pressure gradient.
One source for the regional stress magnitude information are results from a hydraulic fracturing measurement campaign in the vicinity of the planned (but never completed) Khudoni dam in 1985 (Rummel & Baumgärtner, 1985). With hydraulic fracturing the minimum stress component can be determined. The following figures shows the depth profiles for effective stresses in two shallow boreholes according to the results of Rummel & Baumgärtner and under the assumption of a vertical stress gradient of 26 MPa/km and a pore pressure gradient of 9.81 MPa/km.
Effective Stress profile with depth for the wells in the Khudoni region based on Rummel & Baumgärtner 1985 and under the assumption of a vertical stress gradient of 26 MPa/km and a hydrostatic pore pressure gradient.
Furthermore, in 1991 hydraulic fracturing stress measurements have been performed in the Tyrnauz deep borehole. The Tyrnauz borehole is a km deep well northeast of the Enguri area at a distance of ca. 60 km. thus, the stress field and was designed as a geothermal well as test well for municipal heating. It is located in granitic rock. There is not much to be found in non-russian literature besides a report by Kruger (1992) summarizing two Russian reports. The stress information from the Tyrnauz well results from hydraulic fracturing within the depth interval of 3721 to 3830 m. Thereby, the well was deviating by 25° from vertical and the hole azimuth is N 25°E. The flow rate for the first test interval was 0.4 m³/min.
In the Tyrnauz well on 24-25 February 1991 a hydraulic fracturing experiment has been performed. These tests had to stop soon due to failure of borehole infrastructure. The results of the first experiments show, that in a depth of ca. 3.7km the minimum horizontal stress is at 81 to 82 MPa. The vertical stress is 96 MPa and the hydrostatic pore pressure at 35.2 MPa.
Stress orientations: can be derived from focal mechanisms in the area as compiled in Tibaldi et al. (2019) and the World Stress Map (www.world-stress-map.org). These data indicate that the maximum horizontal stress SH is oriented N155-N160° E to N-S.
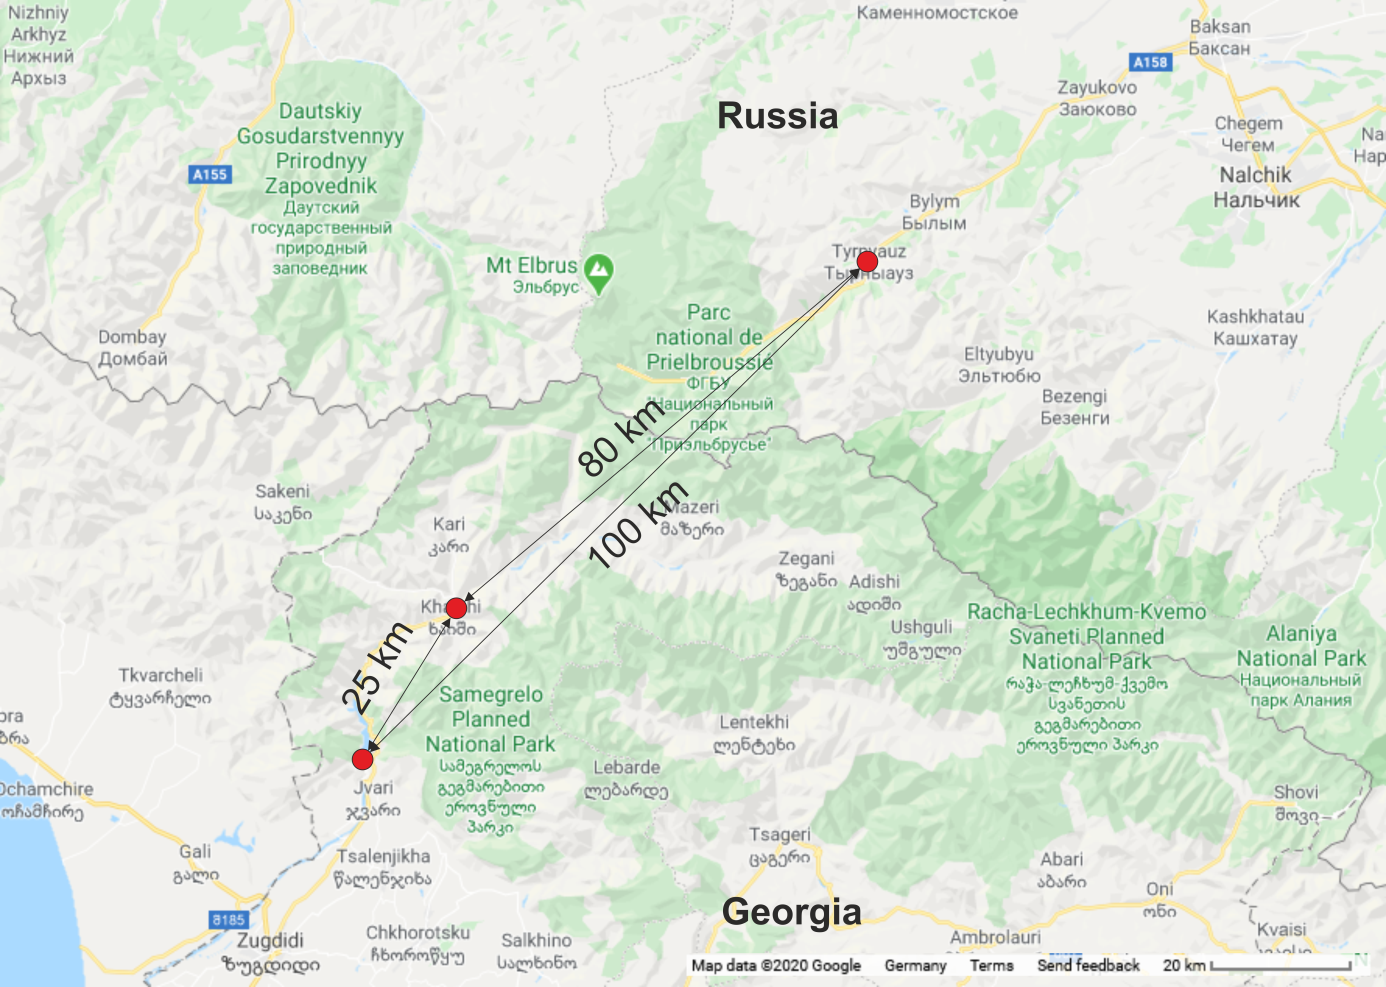
The in-situ stress data from hydraulic fracturing experiments are at a distance of ca. 25 km (Khudoni-site) and ca. 100 km (Tyrnauz-site) available.
Geomechanical investigations:
During the DAMAST project, 2 deep drillholes (KIT-1, KIT-2) and several shallow drillholes (KIT-3, KIT-4, Shtolna-1) have been drilled at Enguri Dam site (see Fig. 1) and further to the north, in Nenskra valley an additional deep well has ben drilled.
These wells and in addition a number of shallow wells close to Enguri Dam and provided by Engurhesi have been investigated in co-operation with our Georgian colleagues from TSU. The following table (Table 1) provides an overview on the measurements until September 2021. For geomechanical purposes the intention was to use acoustical and/or optical televiewer tools for the logging. However, some of the wells have not been accessible with the winch unit of the televiewers, but only with the lighter and smaller one of the video unit of our Georgian colleagues. In total, numerous measurements could be performed (Table 1).
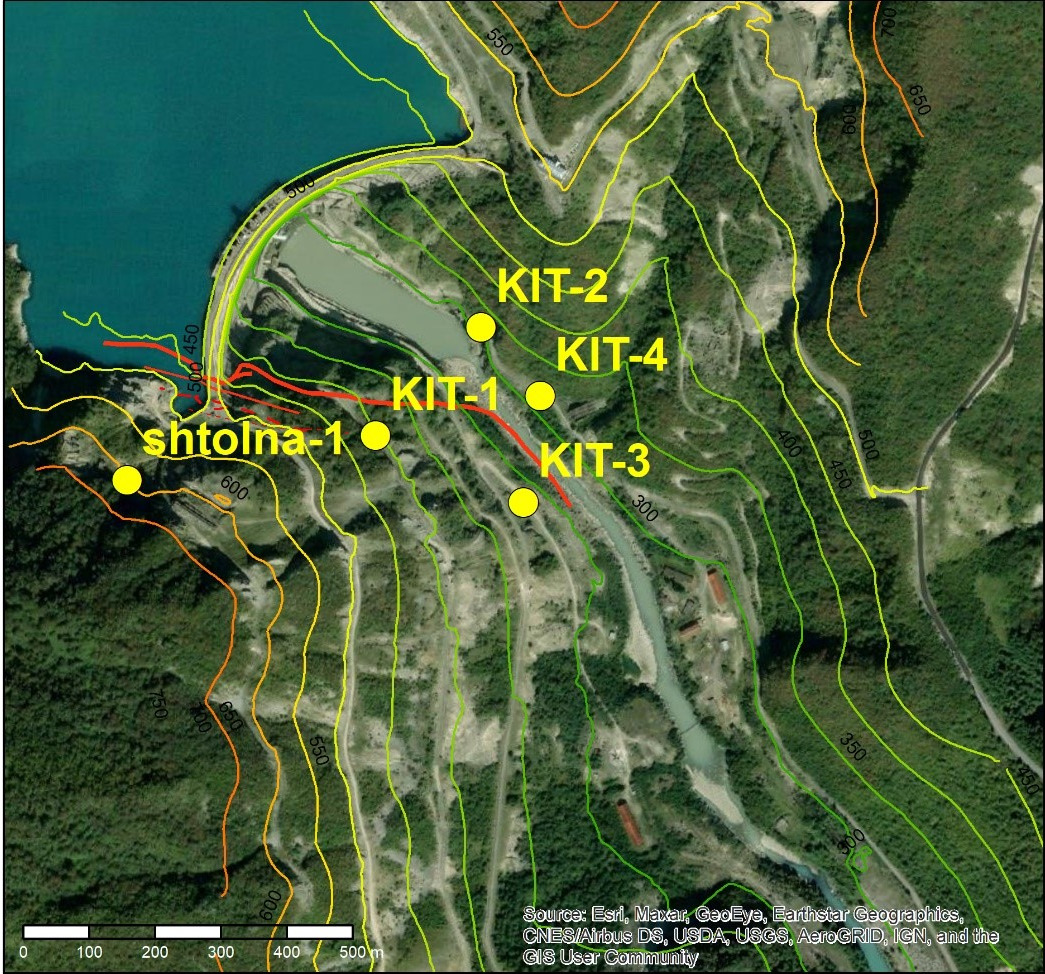
Table 1: Measurement overview. ABI is acoustical televiewer, OBI is optical televiewer, Video is an unoriented borehole camera, 3arm Cal and 4arm Cal are three and four arm caliper tool, respectively.
| Well Name | Coordinate N | Coordinate E | Water level [m] | Date of measurement | Measurement Type | Depth Range [m] | Logged by |
| DAMTOP #1 | 42.76046 | 42.03535 | 43.0 | 18.09.2020 | Video | 0-60.4 | Eco-Risk |
| 42.76046 | 42.03535 | 43.0 | 19.09.2020 | Gamma, 3 | 0-60.4 | Eco-Risk | |
| 42.76046 | 42.03535 | 43.0 | 19.09.2020 | 3arm Cal | 0-60.4 | Eco-Risk | |
| 42.76046 | 42.03535 | 43.0 | 05.10.2020 | Televiewer | 43- | AGW-TP | |
| DAMTOP #2 | 42.76049 | 42.03535 | 25.0 | 18.09.2020 | Video, up, down | 0-34. 8 | Eco-Risk |
| Rummel-Tunnel (BH-1) | 42.037399 | 42.761363 | 0 | 18.09.2020 | Video | ca. 27 | Eco-Risk |
| BH KIT-1 | 42.756312 | 42.033533 | 46 | 19.09.2020 | Video | 49.2 | Eco-Risk |
| 42.756312 | 42.033533 | 112 | 03.10.2020 | Video 2 x | 0-143 | Eco-Risk | |
| 42.756312 | 42.033533 | 112 | 03.10.2020 | 4arm Cal(up) | 0-143 | AGW-TP | |
| 42.756312 | 42.033533 | 112 | 03.10.2020 | ABI (up, down) | 0-143 | AGW-TP | |
| 42.756312 | 42.033533 | 112 | 04.10.2020 | ABI (below drill string, up, down) | 164-214 | AGW-TP | |
| BH-KIT-2 | 42.7584 | 42.03542. | 7 | 20.10.2020 | 4arm Caliper | 0-307 | AGW-TP |
| 42.7584 | 42.03542. | 7 | 20.10.2020 | ABI (up, down) | 0-307 | AGW-TP | |
| 13.09.2021 | OBI | ||||||
| BH-KIT-4 | 22.09.2021 | ABI (up, down) | |||||
| 22.09.2021 | OBI (up) | ||||||
| 23.09.2021 | ABI (up) nach Frac | ||||||
| Shtolna-1 | 42.755584 | 42.028959 | 3 | 04.10.2020 | ABI (up, down) | 0-14.6 | AGW-TP |
| 42.755584 | 42.028959 | 3 | 03.10.2020 | Video | 0-14.4 | Eco-Risk | |
| SchumovWell, left bank, LC 3-2 |
42.034764 | 42.760324 | Video, not accessible for big winch | Eco-Risk | |||
| SchumovWell, left bank, LC 5-5 |
42.033783 | 42.033783 | Video, not accessible for big winch | Eco-Risk | |||
| SchumovWell, left bank, lowest level |
42.75888 Tunnel entrance |
42.03295 | 0 | 06.10.2020 | ABI, 76 mm well diameter. Well was accessible only to 41 m. Drilling from September 29 until October 2 2020 |
0-41 |
AGW-TP |
| KIT-Nenskra | 19.09.2021 | ABI (up, down) vor Frac | |||||
| 21.09.2021 | ABI (up, down) nach Frac |
Brief Information on drilling, logging and completion of Scientific Well KIT-1:
Well KIT-1 has been drilled on the western shores of Enguri (right bank) at the slope of the nearby mountain range, the wells KIT-2 and KIT-4 have been drilled close to the valley bottom on the left bank.
One intention for KIT-1 well was the so-called branch fault. Its strike was assumed to be ca. N 110 °E and its dip towards the hill more or less southward. With KIT-1 this branch fault could successfully be drilled. However, drilling the fault was not easy, frequently the drill string got stuck. Finally, the well was stopped at 208 m depth.
Due to the water level, the acoustic borehole televiewer could be used below 112 m only. Above, our colleagues from Tiflis State University logged with their borehole camera. At about 140 m the televiewer got stuck because the rock in the fault zone were blocking the drillhole.
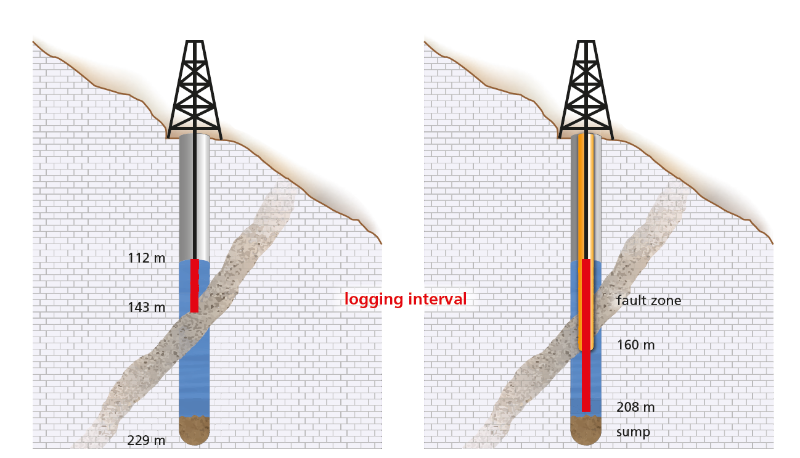
Figure 2: Schematic diagram of Well KIT-1. Due to the fractured rock situation, the water level in the borehole was only at 112 m depth which is one reason for harsh drilling conditions. Furthermore, the drilling of the fault zone caused lots of problems for the drillers.
The drillers and our logging expert could solve the problem. Because the slimhole televiewer did fit through the drill string (we did core drilling). The drillstring was built into the borehole, removed the blocks until ca. 160 m and covered the sensitive section of the fault zone. Then we could log down to the well bottom with the televiewer.
The wells KIT-2 reached 307 m and KIT-4 70 m, KIT-3 is rather shallow (20 m) and used for water level measurements.
Data Analysis:
Immediately after drilling and coring of the wells, the data analysis started. This consists of structural core analysis of drill cores. Each drill core was investigated for structures, natural faults as well as induced fractures and petal centreline fractures). The puzzling of the drill cores was over several months the task of some of the team. The analysis of KIT-1, KIT-2, KIT-4 drill well cores has been completed, the Nenskra drill core analysis will be finished in March/April 2022. The cores of KIT-1, KIT-2 and KIT-4 had been scanned with a CoreScan 3 in Autumn 2021. This helps to orient the drill cores when the core scans can be compared with the televiewer records. As some fractures are only visible in the drill cores and not in the logging data it is an important step to get the orientations of the fractures within the geographic co-ordinates system.
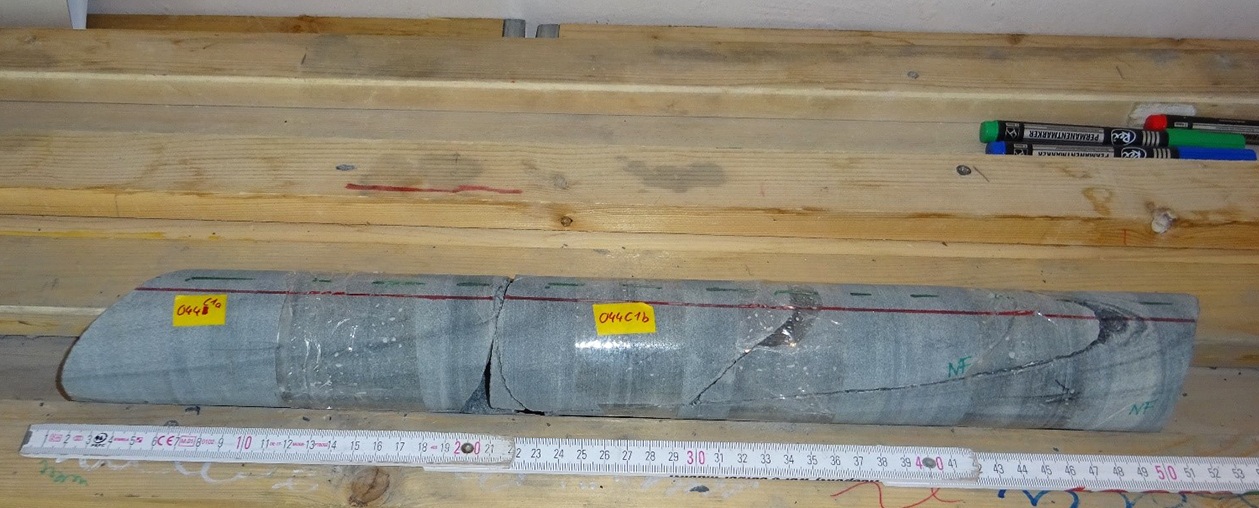
Figure 3: Drill core of Nenskra borehole with bedding and fractures, analysed in detail in our field lab in Georgia. The red line indicates the connection line of the drill cores, the dashed green line helps to identify the upper and lower sides of the cores respectively. It is looking down the well, the dashed line has to be to the left of the red line.
Stress orientation analysis has been finished for KIT-1, KIT-2, and KIT-4. The logging data have been investigated for stress induced borehole breakouts, drilling induced fractures. Fig. 4 shows an example depth interval with breakout sections of borehole KIT-2.
In addition, the numerical modelling has been extended towards the northern part, including also the Nenskra valley.
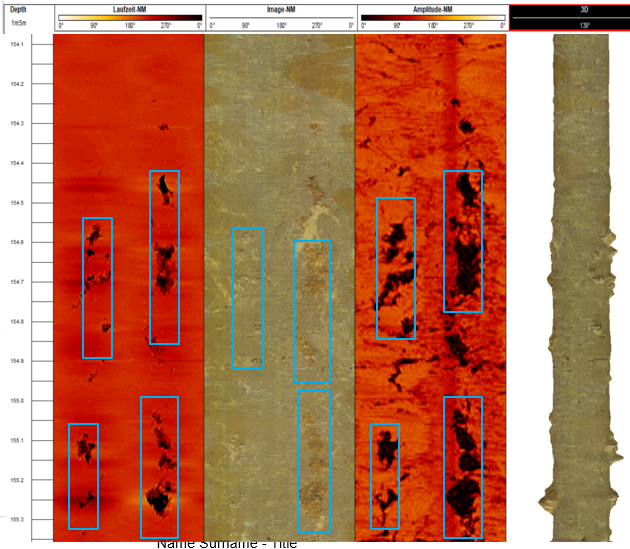
Figure 4: Example for a breakout section in borehole KIT-2. On the very left, the travel time of the acoustic borehole televiewer recordings is displayed, in the centre the optical televiewer and on the right the amplitude image of the acoustic borehole televiewer is displayed. On the very right the image of the optical televiewer is superimposed on the travel times to create a 3D image.
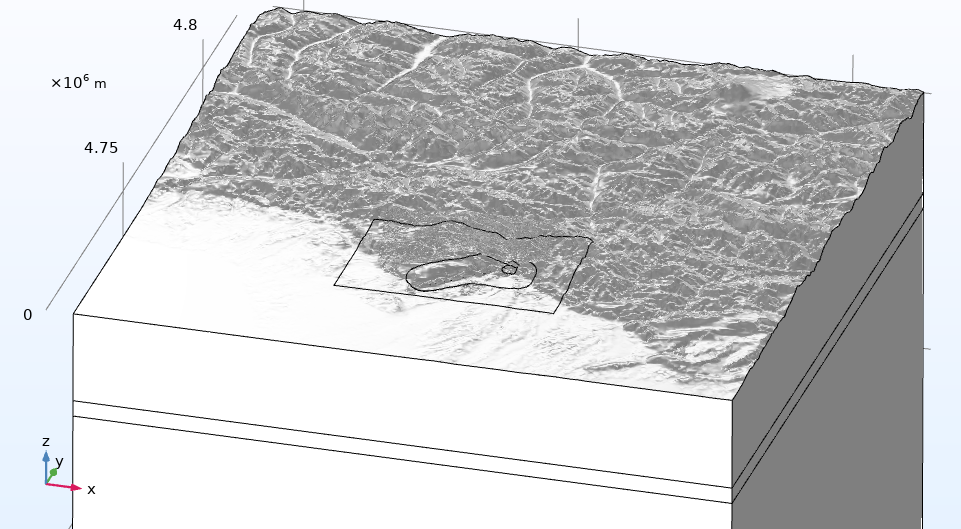
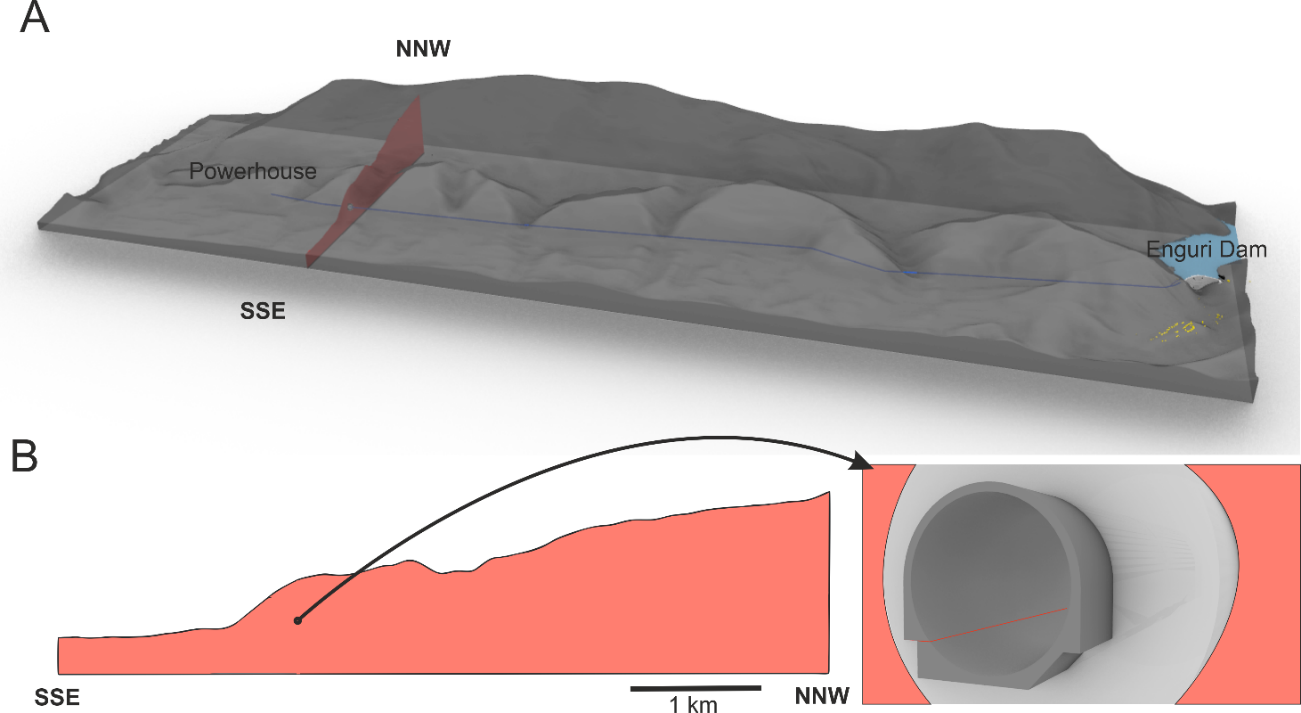
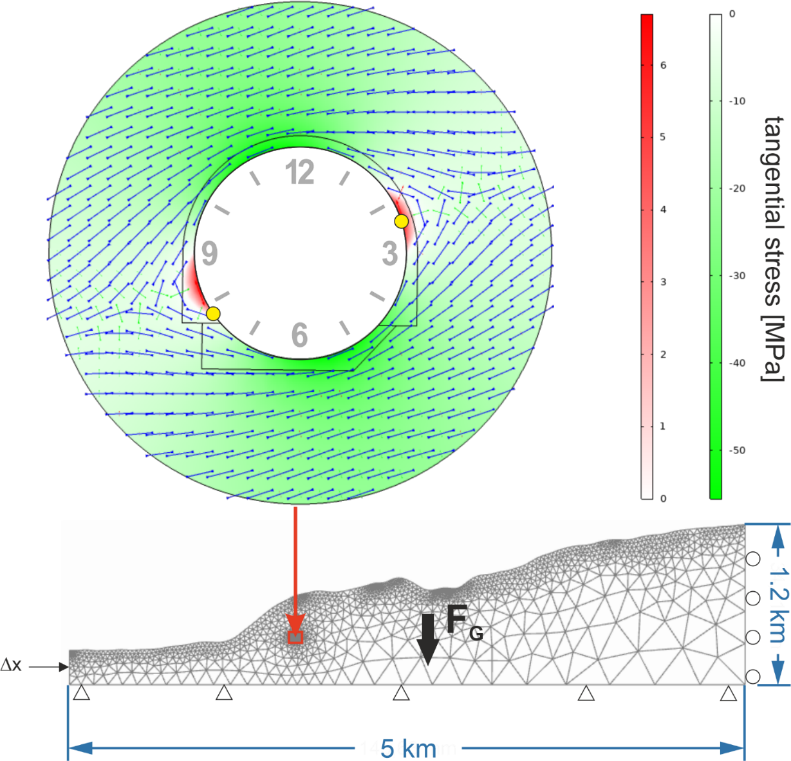
Figure 5: Extent of the numerical model. The smaller areas within have been set-up with a denser mesh for the numerical modelling. The higher density mesh includes the Enguri Dam area and the Power Tunnel area. Numerical model by T. Niederhuber.
A detailed model of the power tunnel between Enguri Dam and the Powerhouse could explain observed tangential stress concentrations in the tunnel wall. The fractures in the tunnel wall could be observed during tunnel rehabilitation in April 2021. The team got the unique opportunity for the tunnel inspections.